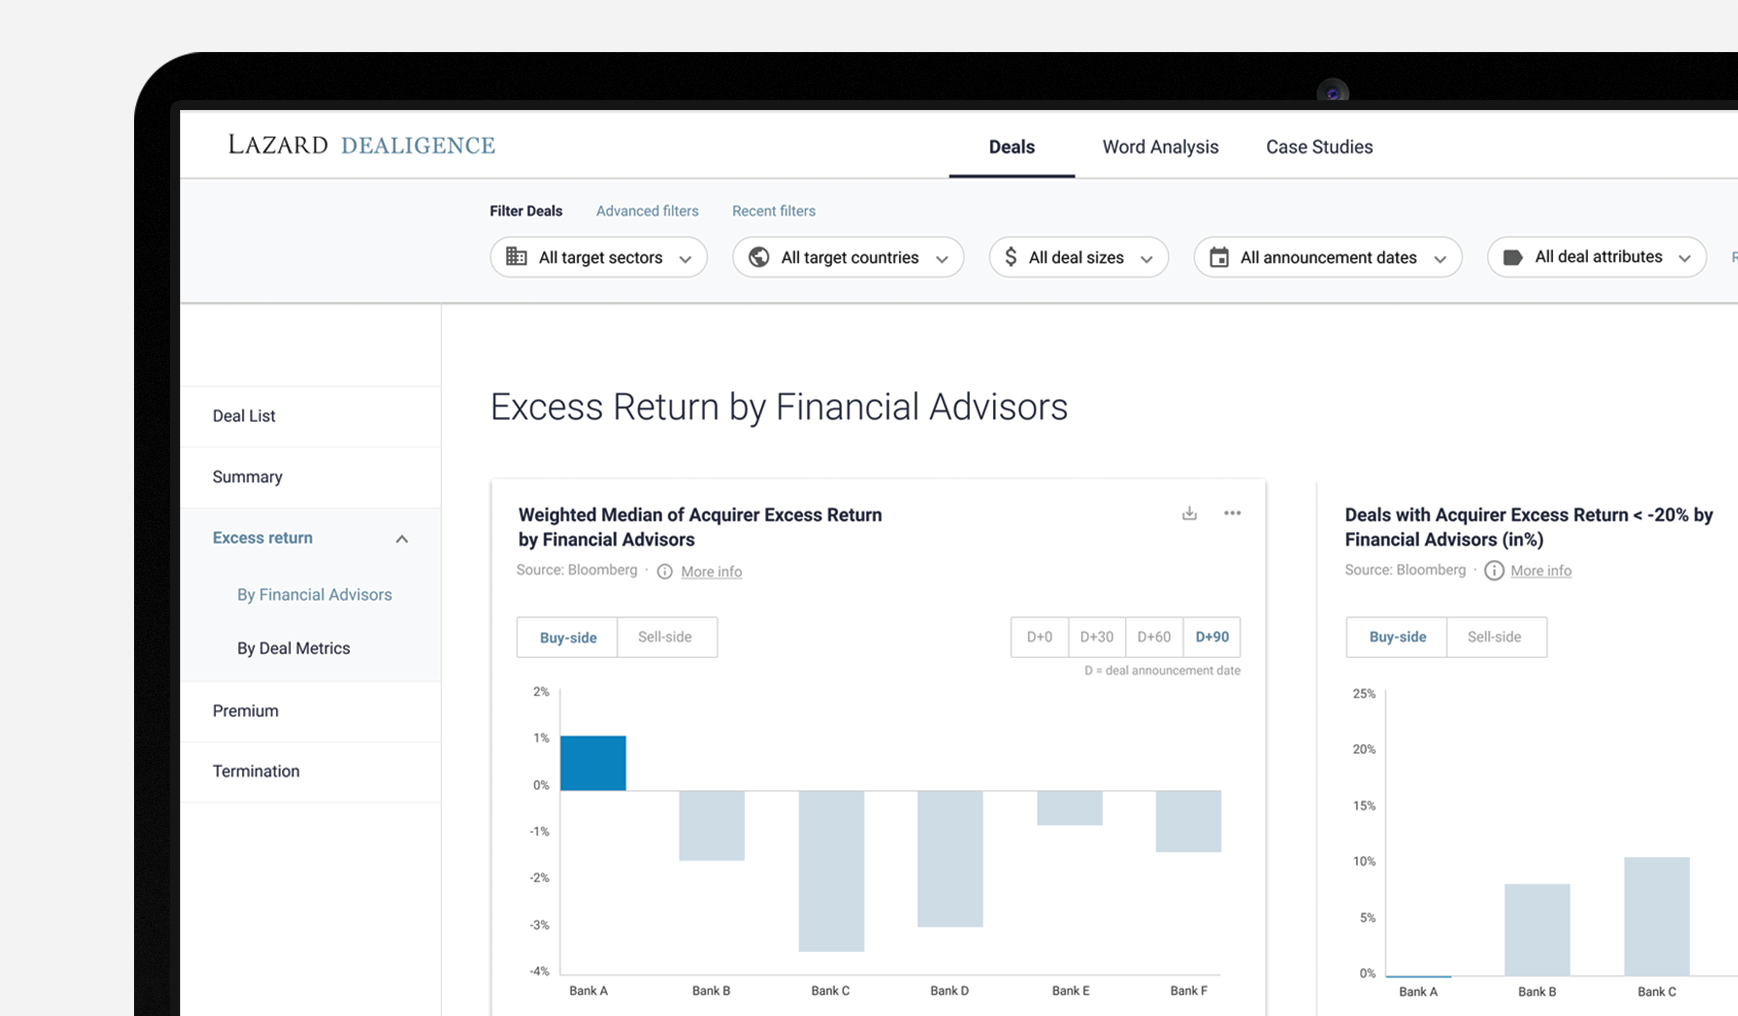
Acquiring a company or separating from one is a risky decision with often millions of dollars at stake. To make the best out of it, many CEO and CFO turn to financial advisory. Best in market, Lazard equipped its advisors with a comprehensive deal database to help them make better informed decisions and increase internal efficiency. I led design to improve the initial prototype and launch the tool.
All confidential information has been anonymized.
Team: 1 Product Lead, 2 Data Scientists, 1 Designer, 1 Software Engineer • Role: End-to-end Design process
APPROACH
In a highly confidential and time-pressured environment, access to advisors was limited. As a result, I looked for proxy users. I interviewed 1 M&A analyst and 3 data scientists since they received analysis requests. Additionally, I ran a heuristic evaluation on the initial tool and supplemented my understanding of M&A advisory through secondary research.
TARGET AUDIENCE
We prioritized advisors as our primary target users to streamline the advisory loop with clients.
Advisors (primary target users)
Goal: advise clients, secure deal success
Focus: trends, big picture, macro level
Data literacy: basic
Main tools: Analyses, Powerpoint

Analysts
Goal: analyze data, uncover issues, de-risk decisions
Focus: data, micro level
Data literacy: advanced
Main tools: Excel, Data file

RESEARCH INSIGHTS
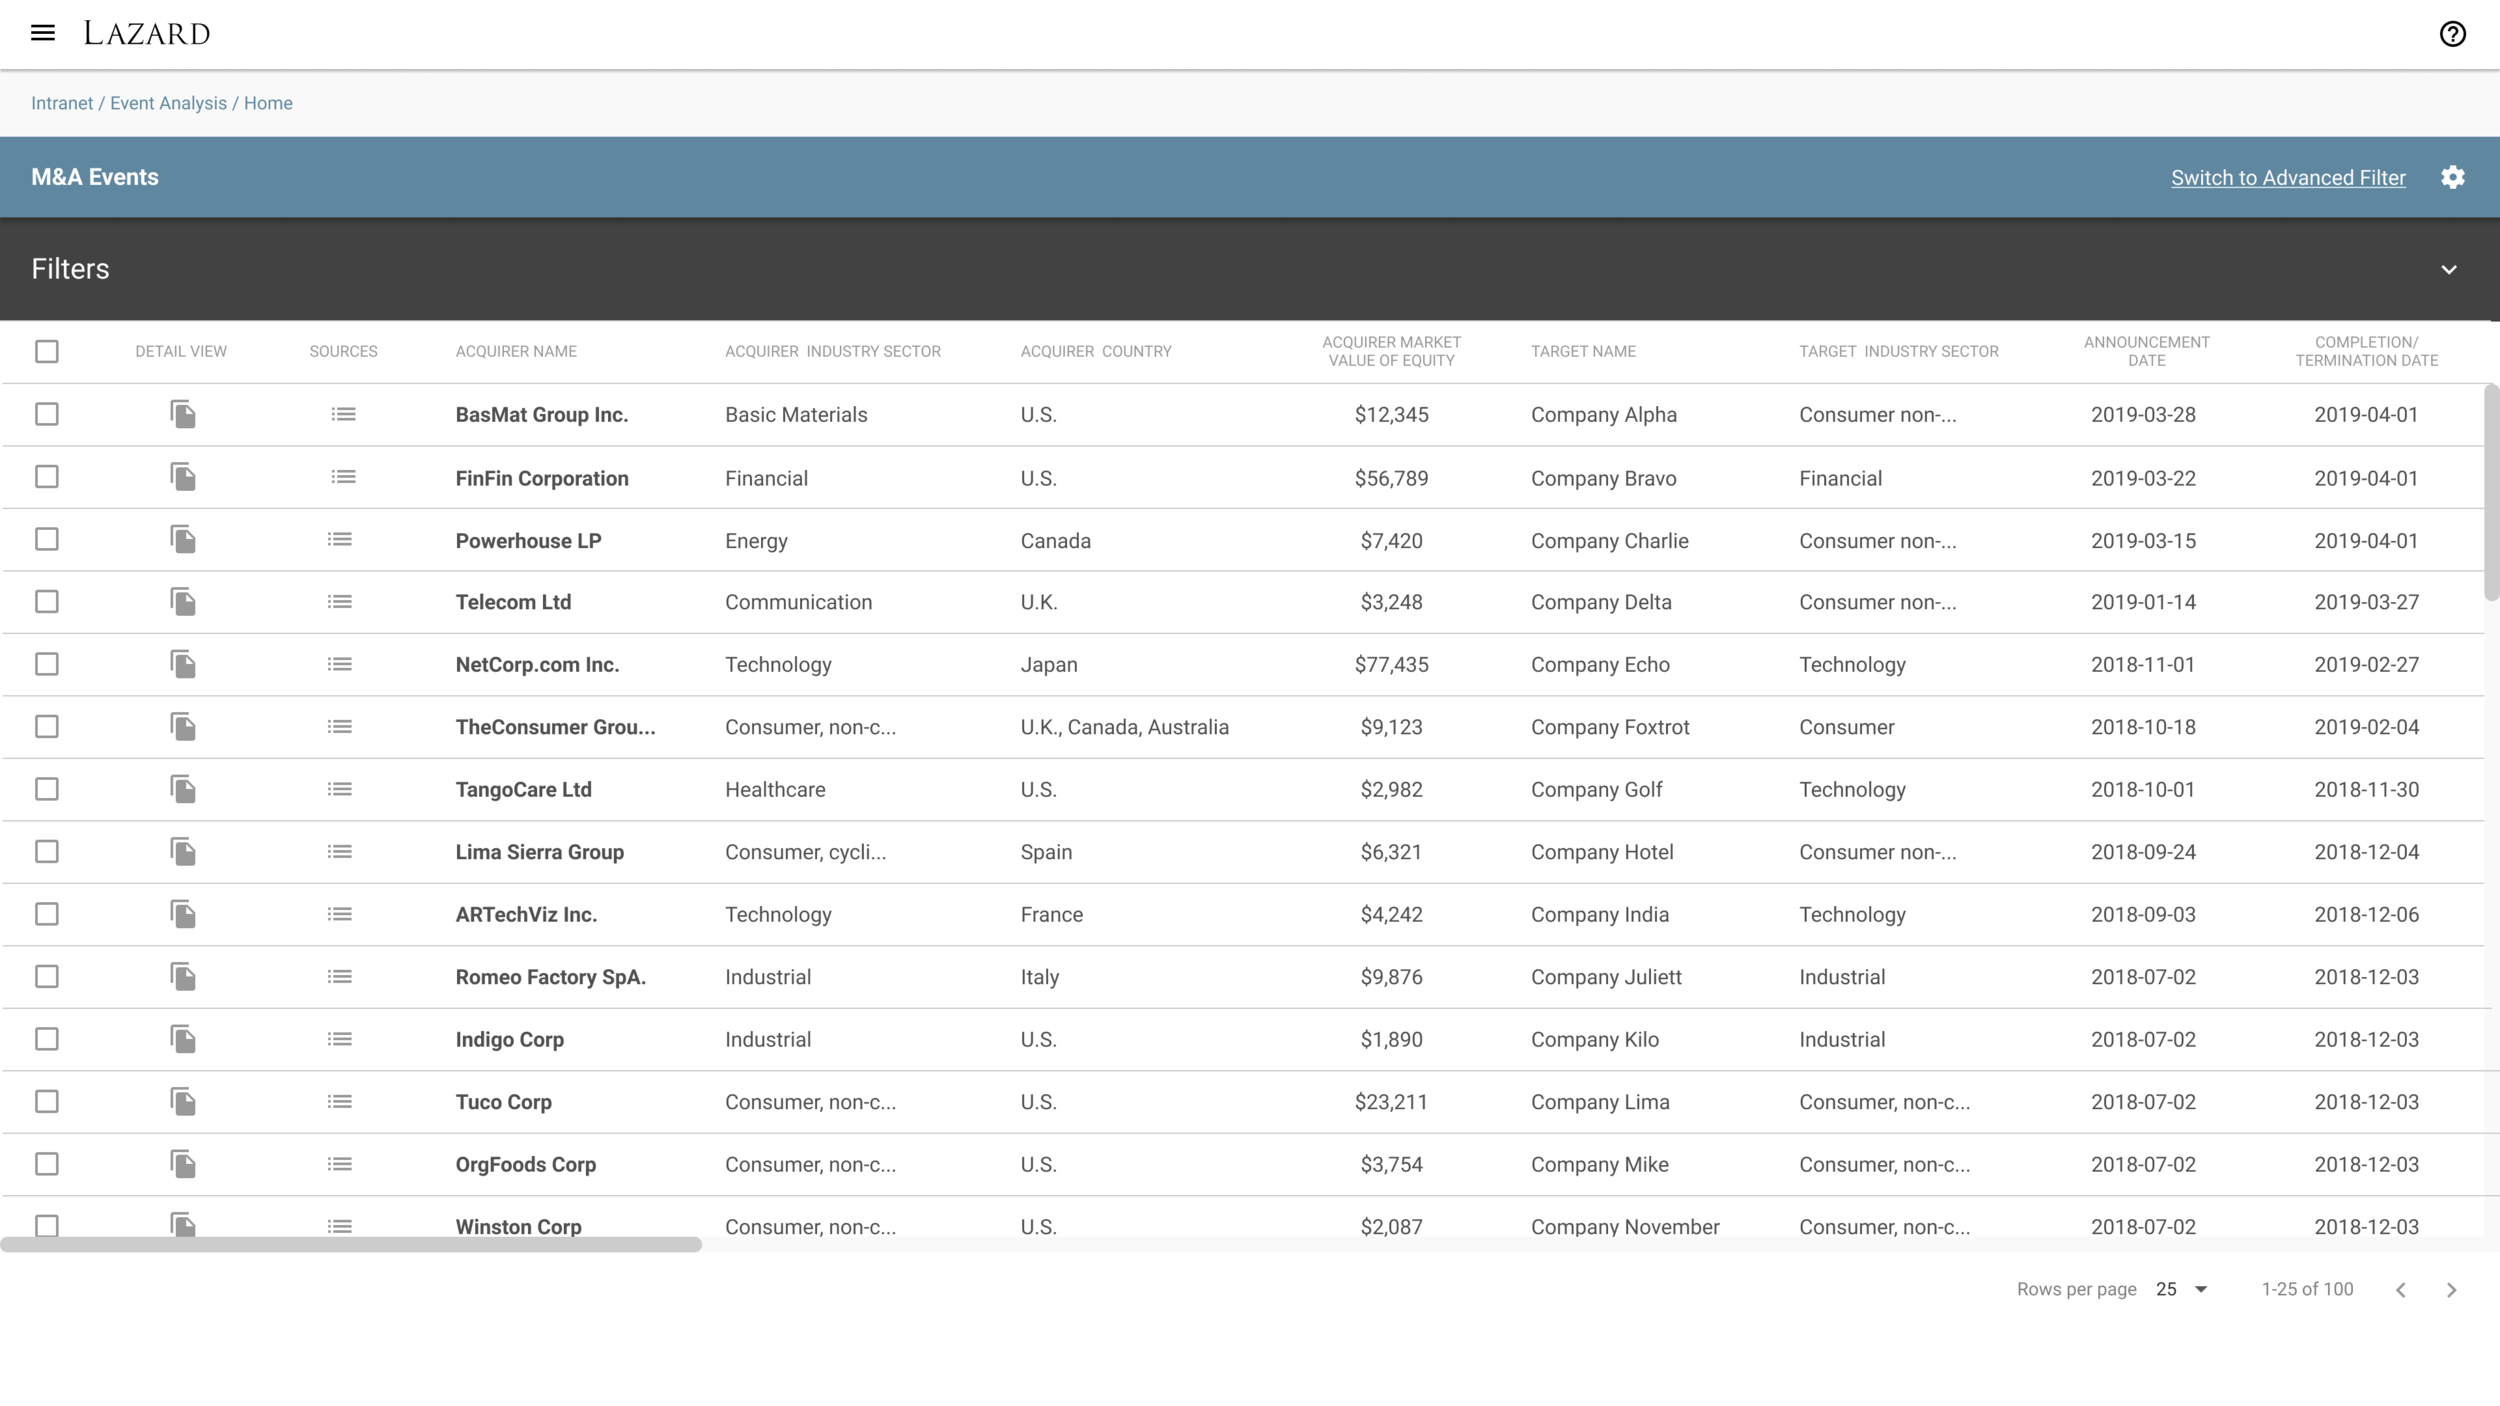
Advisors need insights to quickly deliver advice to their clients. Despite access to a comprehensive and centralized database, with the initial tool, advisors have hard times drawing insights quickly and work with data more autonomously:
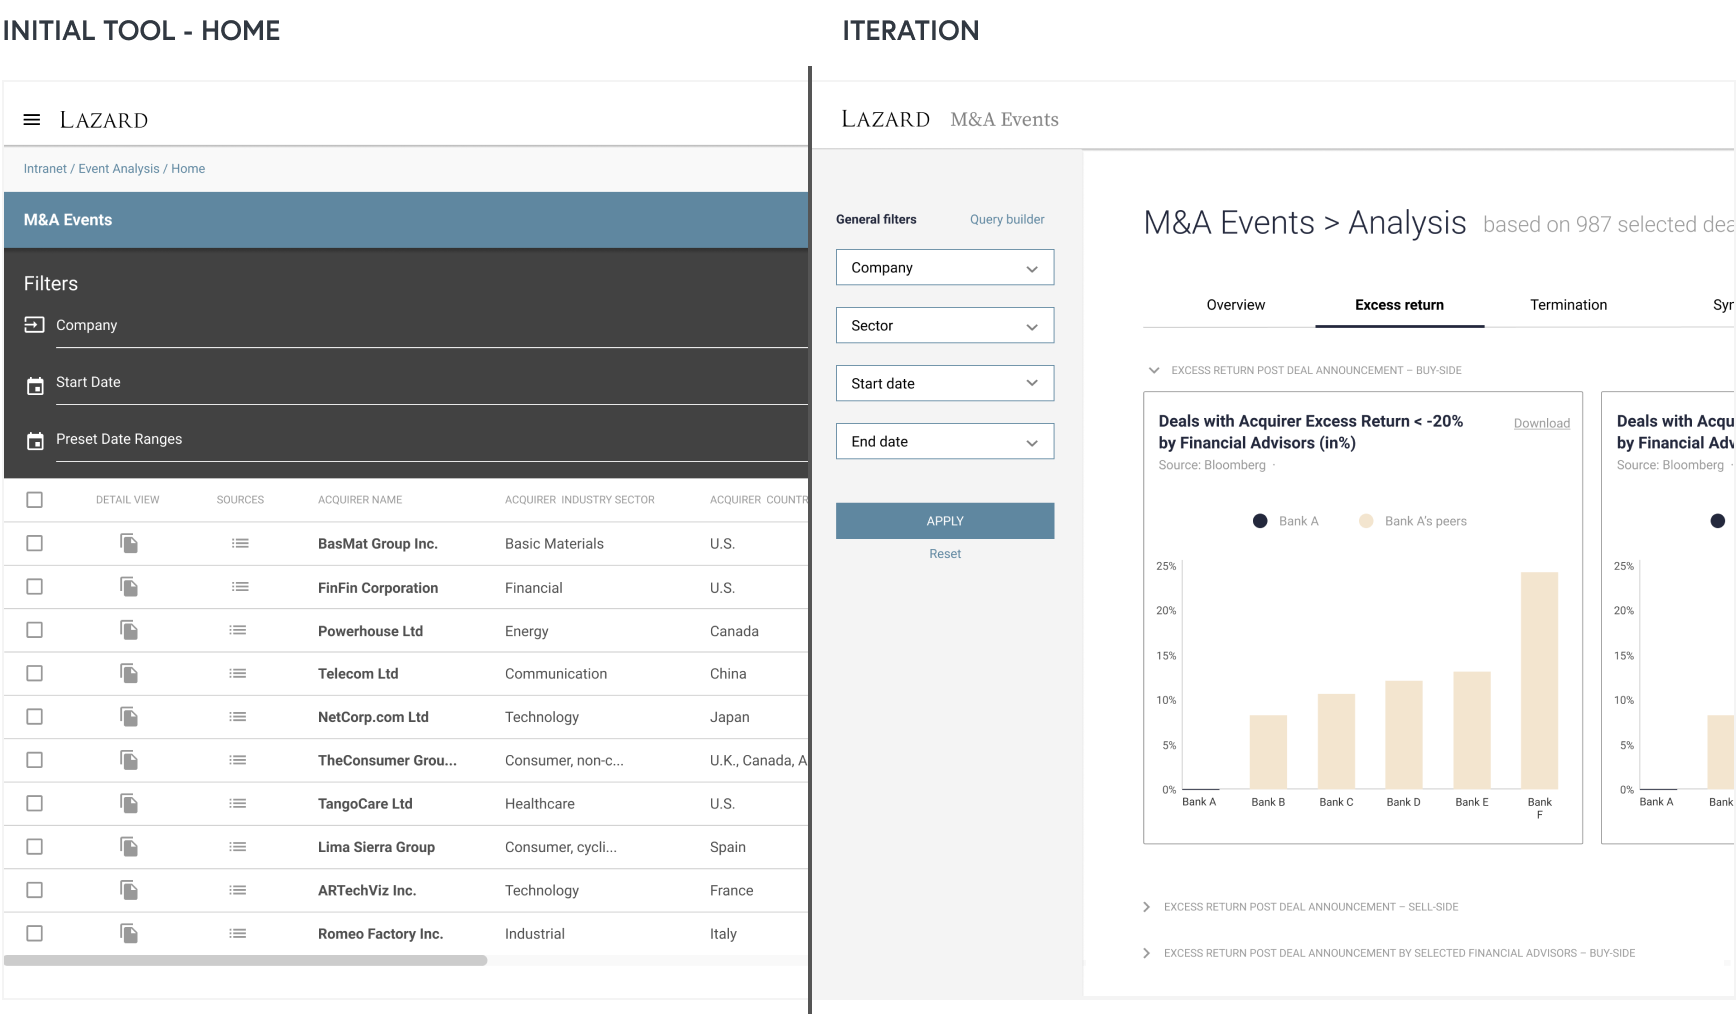
Advisors are not after data. They are after insights and no analyses were available.
The workflow remained the same. Advisors are still dependent on analysts to turn data into insights.
The tool and content spread over 200+ columns were hard to navigate. Filters were hard to find while insights were hard to draw due to the overload of raw data.
DESIGN EXPLORATION AND TESTING
To include analyses, I explored different workflows, layout, and UI through sketches and gradually moved to wireframes and low-fidelity mockups. After review with the product lead and engineer, I tested 3 concepts with the M&A analyst and data scientists.
TESTING INSIGHTS AND SOLUTION
Providing analyses directly was too disruptive. Users wanted to look first at the deals included in the analyses. To reduce the friction, I adapted the flow so advisors would preview the deal list as a checking step before accessing the analyses. This reinforced trust and confidence.
Users filtered first but wanted to do it once. I addressed this by putting the filters at the top in a fixed panel and a list of analyses in a left panel. After redesign, the users were sure the filters would carry over.
Information density matters for the users. Users craved for more information. To prevent the feeling of missing out on information, I kept the deal list as a table while making it easier to parse and customize. As a result, users loved the flexibility and insightful format.
FINAL DESIGN
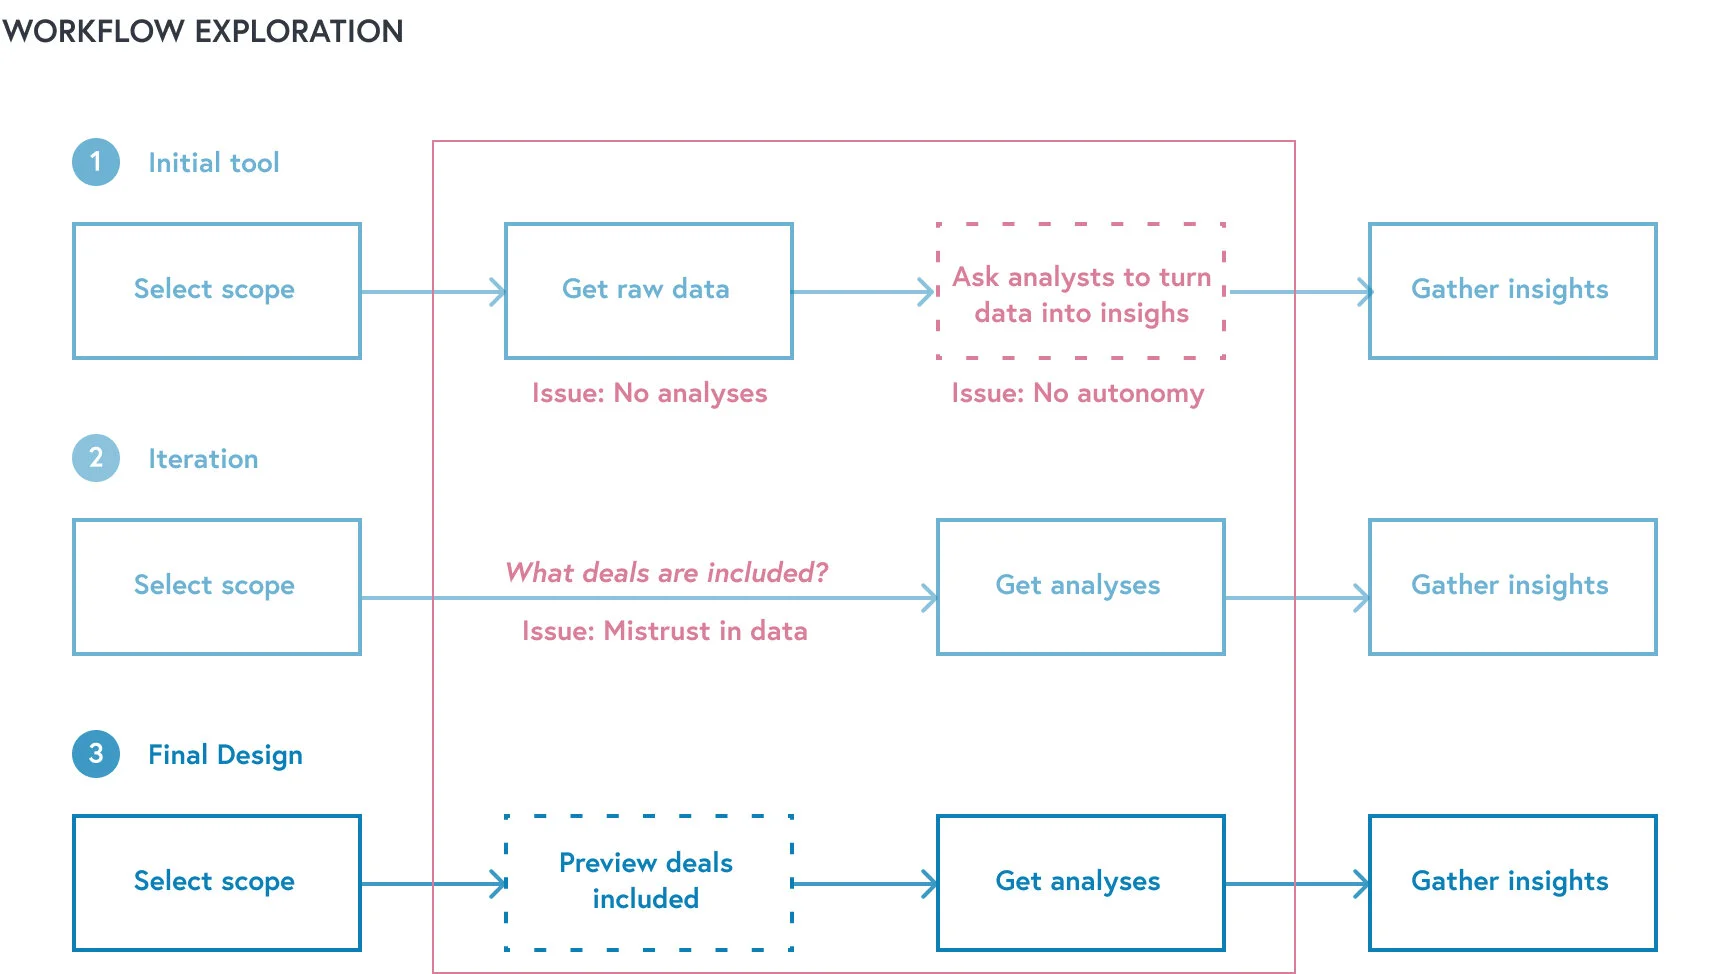
I addressed insights from testing:
Navigation is clearer (points 1 and 2)
Trust in data is improved with the deal list as a preview before accessing analyses
The deal list is easier to parse (points 3-5) and customizable (point 6)
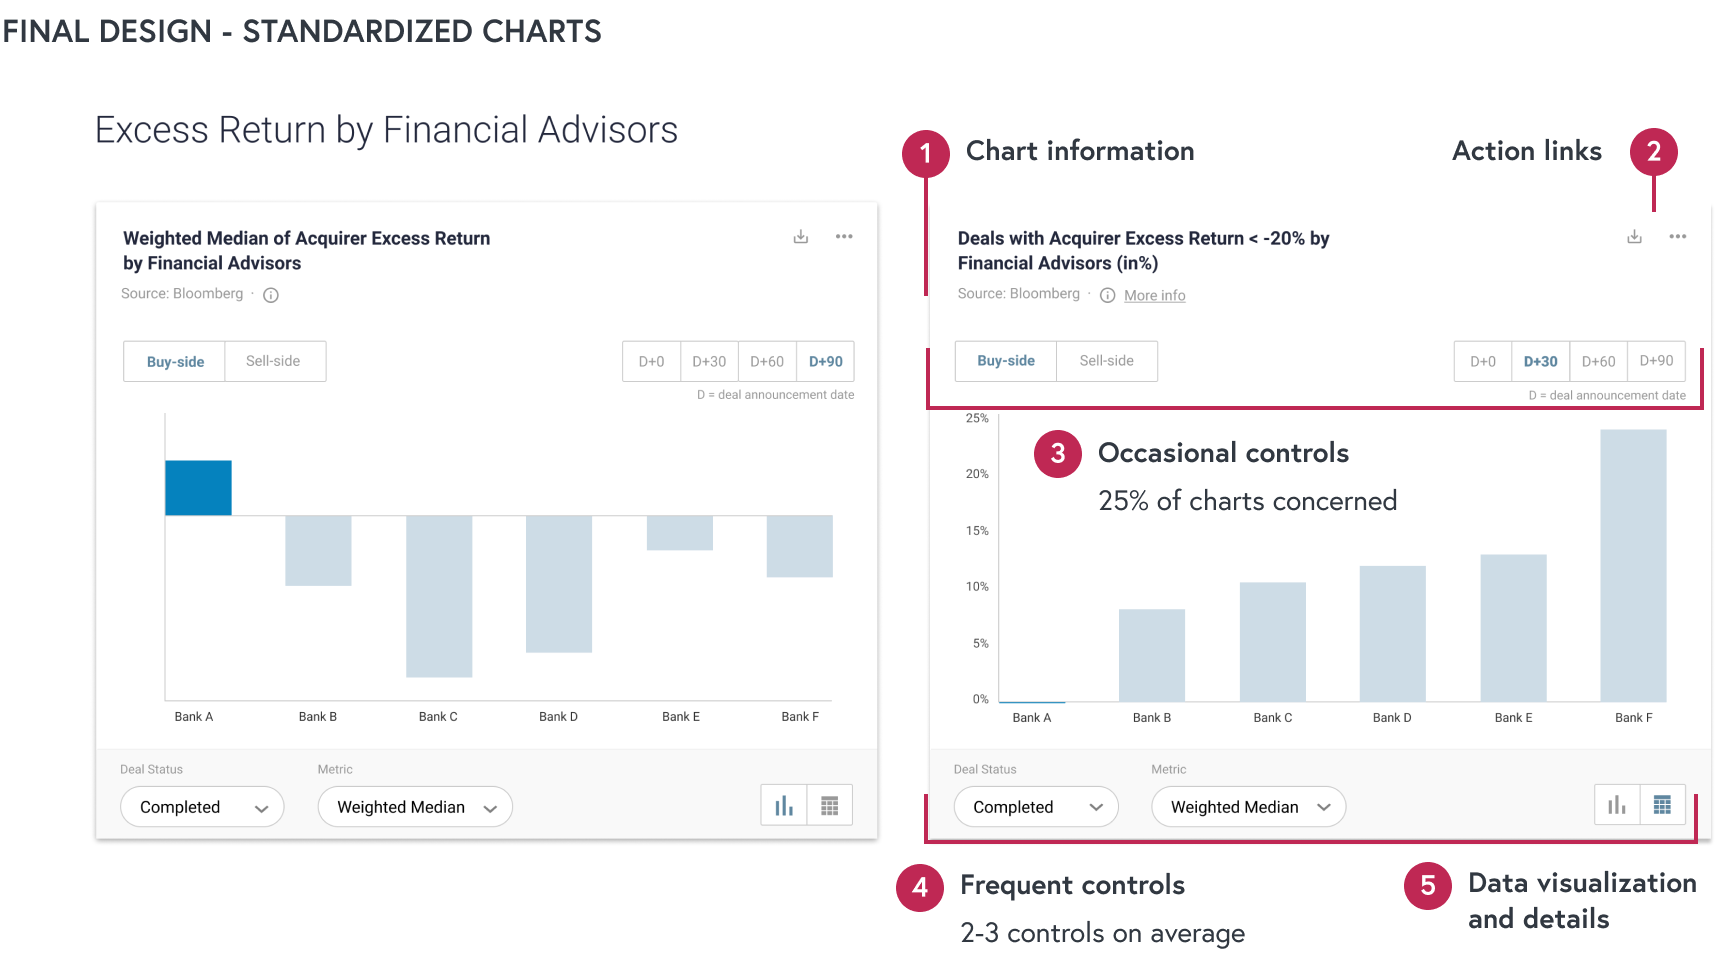
I streamlined the preparation of client presentation by standardizing charts (points 1-5). Therefore, advisors could focus on gathering content and exploring data instead of design.
IMPACT
With the redesign, I improved streamlined advisors’ workflow that we measured with task completion time. Moving from raw data and inefficient workflow to:
Faster analysis delivery and autonomy: Advisors can gather insights on their own within a few minutes instead of hours. Data preparation is already taken care of for the benefits of everyone.
Faster preparation of client presentations: Advisors can download the standardized charts, copy and paste them in their documents without spending time on design.
User satisfaction and trust in data: the tool was very well-received from executives, advisors, and analysts. Users felt the analyses were reliable.
RELATED PRESS
LEARNINGS
Seeding a design and user-focused culture
Being the sole designer in a multidisciplinary team with limited design exposure, I had to balance evangelizing design methodologies and delivering on a tight schedule. Despite the roadblocks to conduct proper user research, we got to a good starting point with our first insights from an end-user interview.
Picking the right level of fidelity for usability testing
Over past projects, I learned that testing low-fidelity mockups with the user base at Lazard was more effective than using wireframes to test early concepts. Having limited exposure to design and wireframes, users were more comfortable sharing thoughts with that medium and level of fidelity.
KEEP EXPLORING
Cellar Management For Wine Amateurs
Licensing Maps For Food Entrepreneurs